
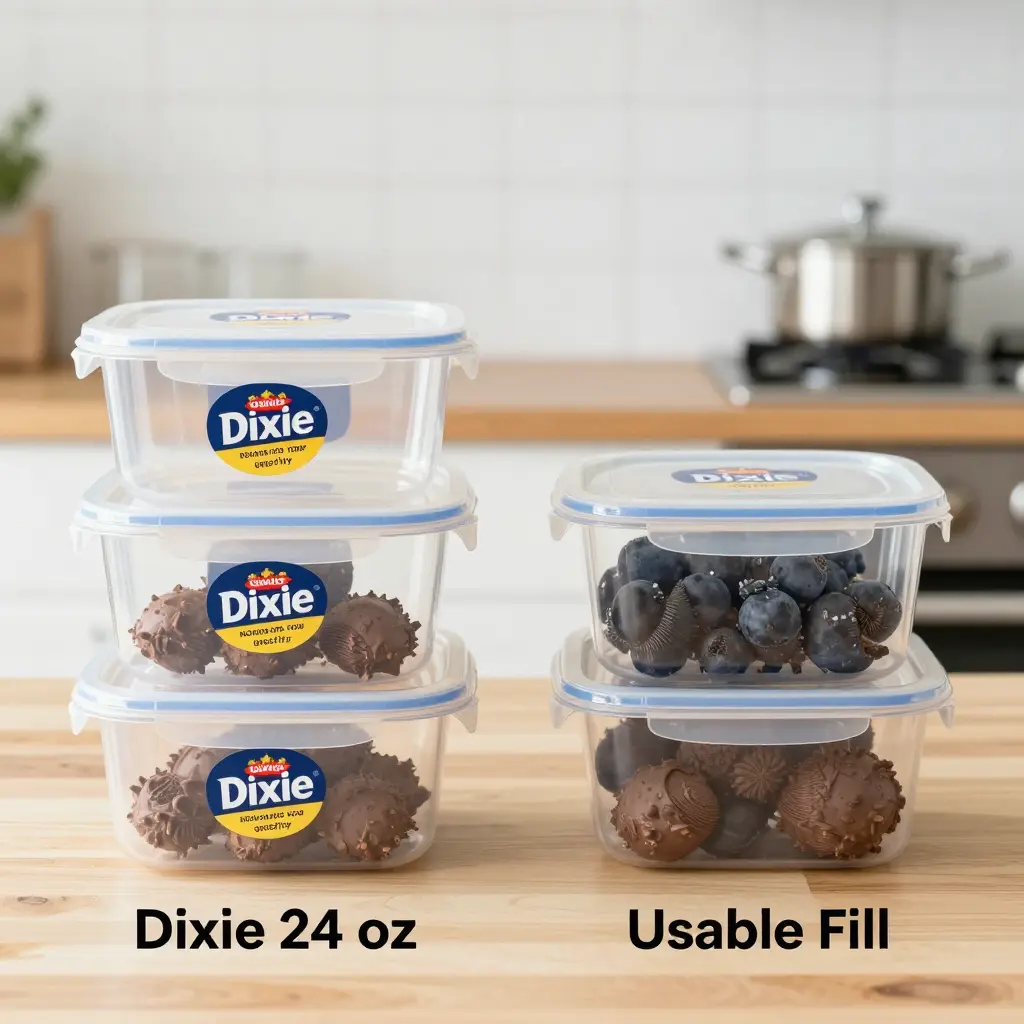
The 24-Ounce Number That Doesn’t Match What You Sell
Dixie 24 oz plastic food containers do not hold 24 ounces of food you can actually serve. The number on the label is nominal capacity; the volume you can really fill sits below it. Miss that gap and your cost per portion is understated, and the difference comes out of your margin.
The number a manufacturer prints on the package is nominal capacity: the container’s full geometric volume, measured to the brim. Usable fill is what you can load during service, once headspace, lids, and settling take their share. The difference is measurable and repeatable, and it changes the math on every portion.
What follows is the size of that gap for Dixie 24 oz plastic food containers, what it does to portion cost, and how to buy by usable fill rather than the label number. The same lens applies when you compare container options across a lineup.
What “Nominal Capacity” Really Means for Dixie 24 oz Containers
When a label reads “24 oz,” it states the container’s nominal capacity: the volume you get filling an empty container to the rim, with no lid, no settling, and no headspace, measured under standardized conditions.
How Labeling Standards and Product Specs Define the Figure
Manufacturers arrive at the figure by filling a container with water to the rim and recording the volume. That result becomes the official container volume rating on spec sheets, sell sheets, and compliance documents. Because the method is the same across brands, the rating lets you compare one Dixie 24 oz container against another brand directly.
Why Manufacturers Use It
Nominal capacity is simple, repeatable, and defensible. It gives food service packaging suppliers one standardized number for marketing, catalogs, and regulatory labeling, and it lets buyers compare products directly.
What Nominal Capacity Does – and Does Not – Guarantee
- Does provide a consistent, comparable volume reference across brands and product lines.
- Does support accurate labeling and compliance with measurement standards.
- Does not guarantee a usable fill for your actual menu items.
- Does not account for lids, headspace, settling, or sauced and layered dishes that leave gaps.
That difference between the label and what a ladle delivers is where portion costs go wrong, so it is worth weighing nominal capacity against usable fill whenever you assess comparable disposable round containers for your operation.
Common sizes, side by side:
| Container Label Size | Nominal Capacity (fl oz) | Typical Usable Fill (fl oz) | Headspace Loss (%) | Recommended Use Case |
|---|---|---|---|---|
| 12 oz | 12 | 10.6 | 12% | Single-serve sides, sauces, small condiments |
| 16 oz | 16 | 13.9 | 13% | Individual entrees, soups, deli salads |
| 24 oz | 24 | 21.4 | 11% | Hearty entrees, combo meals, family sides |
| 32 oz | 32 | 28.8 | 10% | Shareable portions, bulk sides, catering trays |
Usable fill trails nominal capacity by 10% to 13% at every size, so portion-cost math should start from the usable figure, not the label. The same principle governs our sauce and portion cups.
Usable Fill Is a Fraction, Not a Promise
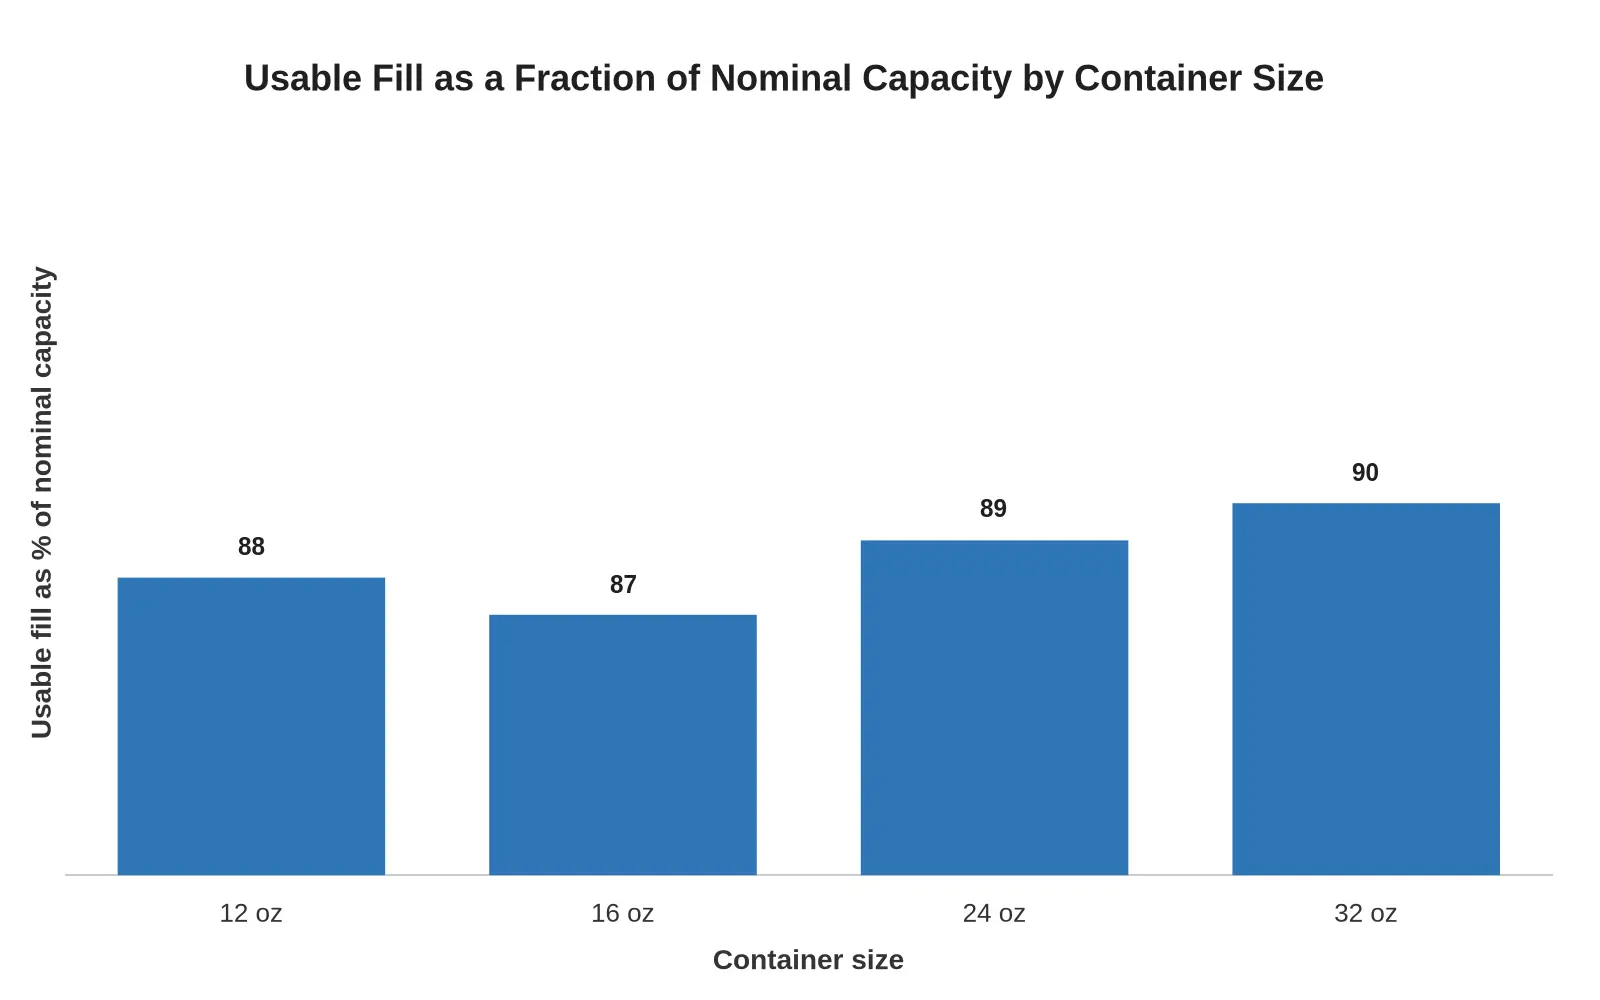
A container labeled “24 oz” carries a nominal capacity: the volume it would hold brim-full. What a kitchen can actually scoop, ladle, or pour into it is the usable fill, always a fraction of the label. Across the common sizes, usable fill runs between 87% and 90% of the advertised number.
What the Bars Tell You
- Every bar sits below the 100% line. No size brings nominal and usable capacity together.
- The spread is narrow. From 12 oz to 32 oz it is three percentage points, so a smaller format will not close the shortfall.
- Bigger containers do slightly better, but not in a straight line. The bars read 88% at 12 oz, 87% at 16 oz, 89% at 24 oz, and 90% at 32 oz. Wider mouths and squarer shoulders leave proportionally less in the “dead zone” above the fill line.
- The percentage hides the money. A 13% gap looks tidy on a spec sheet; across hundreds of servings a day it is where portion cost drifts.
Why This Matters for Portion Cost
Cost a portion from the nominal number and your food-cost math assumes volume you never dispense. A 24 oz container at 89% usable fill yields about 21.4 oz, or 2.6 oz less than the label. Price that shortfall against your per-ounce ingredient cost and it becomes a recurring line item, not a one-time error.
Treat nominal capacity as a ceiling and usable fill as the planning number. Build recipes, portion yields, and menu pricing around it, and the gap stops surprising you on the P&L.
Quick rule of thumb: Add about 12% to any cost estimate built on nominal capacity to approximate usable yield, then confirm it with your own fill tests.
If you are standardizing a takeaway lineup, match the format to the fill volumes your menu actually produces. Browsing takeaway boxes by category is one way to do that.
A Dixie 24 oz plastic food container rated for 24 ounces still has a practical “usable fill” smaller than the label, because several everyday factors take space before anything settles. That is why matching the right container format to your menu matters.
- Lid and dome clearance. A recessed or domed lid needs vertical room to close without crushing the contents, so the top inch of the container is effectively off-limits for food.
- Headspace for transport. You must leave a buffer of empty air below the rim so sauces and loose items do not slosh or spill when the container tips during delivery.
- Irregular or stacked product shapes. Chunky, angled, or layered foods leave gaps that flat volume math ignores, so the same amount of product occupies more of the 24 oz than expected.
- Serving-tool residue. Spoons, scoops, and ladles coat with product and drip back, meaning a little of every portion is lost to the tool rather than reaching the customer.
- Settling and compaction. Powders, grains, and shredded items compact under their own weight and vibration, so a container filled to the top can look full yet weigh less than the nominal figure.
Cost Implications and Purchasing Guidance: Closing the Fill Gap
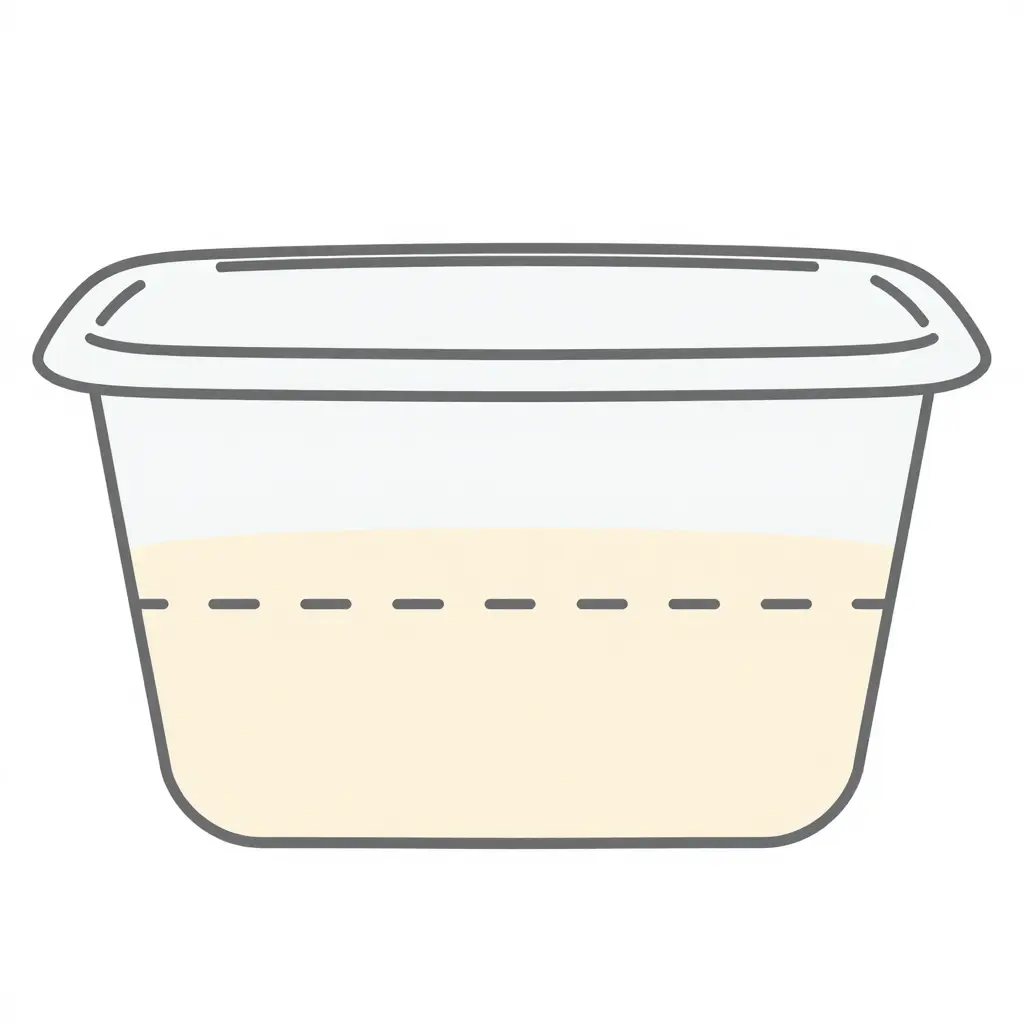
The gap between nominal capacity and usable fill shows up in your food cost. Buy Dixie 24 oz plastic food containers and you pay for 24 ounces of molded space; the customer gets what fits below the rim. Price portions against the label and you are charging yourself for volume you never deliver. Here is how that plays out in purchasing and pricing.
Re-evaluate cost per delivered ounce, not per container
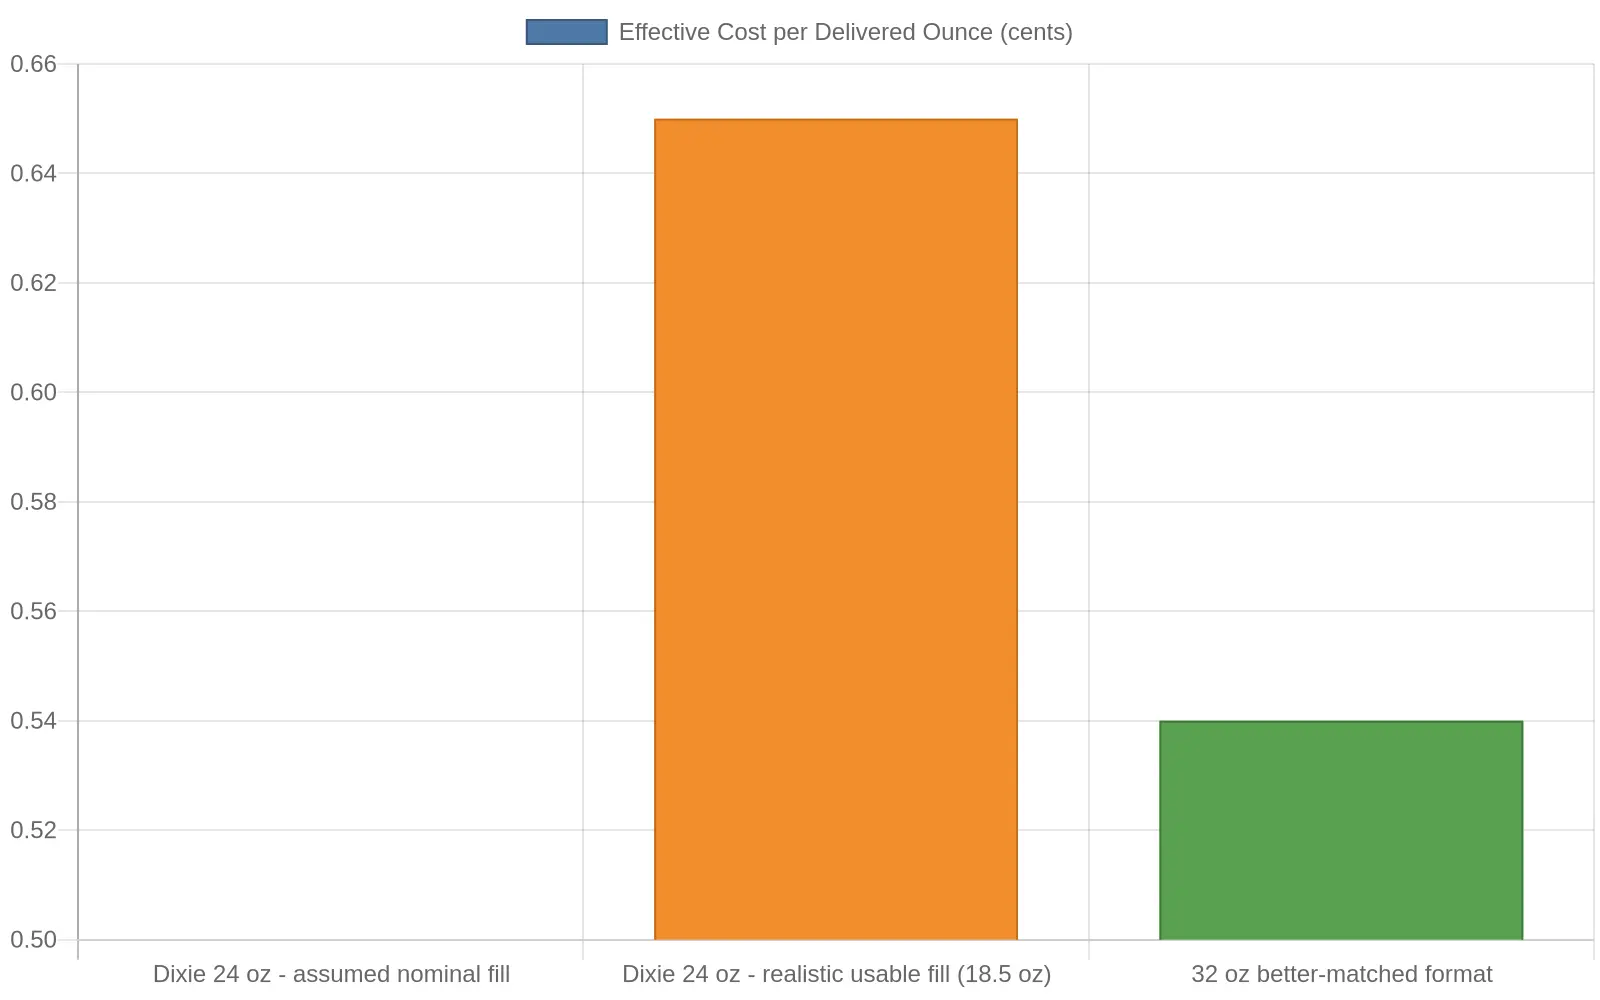
Compare containers by delivered ounce, not case price. Divide the per-unit packaging cost by realistic fill. A $0.12 container that holds 21.4 ounces costs about 0.56 cents per delivered ounce, while budgeting against the full 24 ounces suggests 0.50 cents. That 12% gap compounds over thousands of servings a week.
| Scenario | Unit cost | Usable fill | Effective cost per delivered ounce |
|---|---|---|---|
| Dixie 24 oz plastic food containers (assumed) | $0.12 | 24.0 oz | 0.50 cents |
| Dixie 24 oz plastic food containers (realistic) | $0.12 | 21.4 oz | 0.56 cents |
| 32 oz better-matched format | $0.15 | 28.8 oz | 0.52 cents |
Re-set menu pricing or portion specs
With the real number in hand, make a deliberate choice: hold the portion and absorb the higher portion cost, or reset the spec with a smaller ladle, a leveled scoop, or a container that matches the serving. Either way, align what you promise with what the container can deliver, so packaging cost stops drifting upward unnoticed.
Let the format do the work
A slightly larger container or a better-matched shape often shrinks the cost gap more cheaply than switching materials. Usable fill scales with usable surface area and depth, so choosing fast food boxes designed around the actual serving can lower the cost per delivered ounce even when the unit price is higher. Comparing trays and plates against lidded containers for the same item often turns up a format that wastes less headroom and delivers more usable volume per dollar.
Review supplier specs and request usable-fill data
Put the burden of proof on your supplier. Ask for working-capacity or usable-fill figures, not just brimful volume, and request a sample fill test at your typical serving temperature. Vendors who publish a delivered-ounce range alongside the nominal size let you model real portion cost before a bulk order, and compare true cost across every format you stock.
How to Calculate Your True Portion Cost
-
Measure usable fill. Fill the container to the level you actually serve, not the brim. If a “24 oz” Dixie container takes about 21.4 oz before it spills or sits below the lid, usable fill is 21.4 oz. Write it down in ounces.
-
Divide the container cost by usable ounces, not nominal ounces. If the container costs $0.18 and usable fill is 21.4 oz, cost per usable ounce is about $0.0084, not the $0.0075 you get from the 24 oz nominal figure.
-
Multiply by the portion size you serve. Serving 16 oz? Multiply $0.0084 by 16 for the packaging share of that portion, about $0.13.
-
Compare against the planned cost. Line this up beside the number you budgeted when packaging was priced on nominal capacity. The difference is the hidden gap that drains margin.
Price packaging against the nominal number and you understate the real portion cost of every serving; the error compounds across thousands of orders. Divide cost by usable fill instead and cost per ounce becomes honest. If one supplier’s “24 oz” container has the same usable fill as a competitor’s cheaper “26 oz” box, the bigger nominal figure is marketing, not value. Recalculating each candidate’s true cost per ounce lets you compare packaging on the metric that touches your P&L, then pair it with the right portion cups and containers to keep portions predictable. Run this on your top five containers and you will likely find a few overcharges worth fixing at the next reorder.
Frequently Asked Questions: Dixie 24 oz Containers and Fill Gaps
Does the “24 oz” label mean I can serve 24 oz of food?
No. The 24 oz figure is nominal capacity, the container’s total geometric volume measured to the brim, usually without a lid. Real usable fill is smaller once headspace, lid clearance, and settling are accounted for. Treat 24 oz as a size class, not a serving amount.
Why does usable fill vary between lidded and open containers?
An open container can be filled close to the rim, so usable fill nearly matches nominal capacity. Add a lid and you lose a band of space at the top, because contents cannot safely reach the edge. The same 24 oz base therefore holds noticeably less food when it is lidded and stacked for transport.
How do I compare portion cost across different container sizes?
Divide the cost per container by its usable fill, not its advertised size. A cheaper 24 oz cup with a wide fill gap can cost more per served ounce than a slightly pricier container that fills efficiently. Running the math across sizes shows which option protects your margin; the same logic applies when you browse plastic cups for cold drinks for other menu items.
Can nominal capacity be used for compliance labeling?
Rarely, and only with caution. Labels are generally expected to state actual net contents, not the container’s brim volume. Declaring the brim figure as the sellable quantity overstates what customers receive and can create accuracy or fair-packaging problems.
What drives the biggest fill gaps in a real kitchen?
Irregular foods create the largest gaps: sauces settle, proteins mound above the fill line, and garnishes need breathing room. Bulky or high-viscosity items rarely reach nominal capacity, while dense liquids come closest. Measuring usable fill for your own menu items gives the most accurate portion cost.